 entrance
Installing Debugging Tools for Windows. Working with Windows Command Line, Debug Program and its Use Download Debug Exe 64 Bit
Debug.exe. - The debugger program that is used to check and debug executing files.
Used at the operating system MS-DOS. . Under later versions operating systems
works through the emulator MS-DOS. And has limited opportunities. Called through a team term
Debug [[Disc:] [Route] File Name [Parameters]].
For example: Debug C: \\ ... \\ My.com
This program It is a console application and is designed to create or change the file code. With it, you can create a simple application under MS-DOS. and track their work. This debugger is at the lowest level of compilers. assembler.. But it has good opportunities, such as viewing and changing the memory, obtaining the status of registers.
Teams debug.exe.
DEBUG.EXE command set rules:
· In debug.exe does not differ register of letters.
· Spaces in commands are used only to separate parameters.
· Input numbers should be in a hexadecimal number system, and without the final letter H.
· Segment and offset are recorded using a colon, in the format segment: offset, for example, CS: 3C1 (offset 3C1H in the code segment) or 40:17 (offset 17h in the segment, the address of which is 40h).
After downloading the debugger, an invitation appears on the screen looking in the form of a hyphen. Registers CS., Ds., Es, SS. At this point, initialized by the address of the 256-byte prefix of the program segment, and the work area in the memory will begin with the address of this prefix + 100h. Teams debug.exe. Implemented immediately after the invitation on the spot, which is marked by the cursor. Each command consists of an identifier and parameters, the identifier consists of one letter.
Table 1. Brief table of all teams Debug.exe
| Team | Description | Format |
| A (ASSEMBLE) | Transmission of assembler commands in machine code; The default address is CS: 0100H. | A [<адрес_начала_кода>] |
| C (Compare) | Comparing the contents of two memory regions; The default DS is used. The command indicates either the length of the plots or the range of addresses. | C.<начальный_адрес_1> L.<длина> <начальный_адрес_2> C.<начальный_адрес_1> <конечный_адрес_1> <начальный_адрес_2> |
| D (display / dump) | Display the contents of the memory area in hexadecimal and ASCII formats. By default, DS is used; You can specify a length or range. | D [<начальный_адрес> ] D [initial_adress finite_adress] |
| E (ENTER) | Commissioning data or machine code instructions; The default DS is used. | E [<адрес> [<инструкции/данные>]] |
| F (Fill) | Filling the memory area data from the list; The default DS is used. You can use both the length and range. | F.<начальный_адрес_1> L.<длина> "<данные>"F.<начальный_адрес> <конечный_адрес> "<данные>" |
| G (GO) | Execution of the well-defined program in the machine to the specified stop point; The default CS is used. At the same time, make sure IP contains the correct address. | G [\u003d.<начальный_адрес>] <адрес_останова> [<адрес_останова> ...] |
| H (Hexadecimal) | Calculation of the amount and difference between two hexadecimal values. | H.<величина_1> <величина_2> |
| I (INPUT) | Reading and output one byte from the port. | I.<адрес_порта> |
| L (LOAD) | Downloading a file or data from the disk sectors into memory; Default - CS: 100H. The file can be specified using the n or argument command when running debug.exe. | L [<адрес_в_памяти_для_загрузки>] L [<адрес_в_памяти_для_загрузки> [<номер_диска> <начальный_сектор> <количество_секторов>]] |
| M (Move) | Copy the contents of the memory cells; The default DS is used. You can specify both the length and range. | M.<начальный_адрес> L.<длина> <адрес_назначения> M.<начальный_адрес> <конечный_адрес> <адрес_назначения> |
| N (Name) | Note the name of the file for commands L and W. | N.<имя_файла> |
| O (Output) | Sailing a byte to the port. | O.<адрес_порта> <байт> |
| P (Proceed) | Performing Call, Loop, Into instructions or a repeated string instruction with Repnn prefixes, moving to the next instruction. | P [\u003d.<адрес_начала>] [<количество_инструкций>] |
| Q (Quit) | Completion of debug.exe. | Q. |
| R (Register) | Display the contents of the registers and the following instruction. | R.<имя_регистра> |
| S (Search) | Search in the memory of characters from the list; The default DS is used. You can specify both the length and range. | S.<начальный_адрес> L.<длина> "<данные>"S.<начальный_адрес> <конечный_адрес> "<данные>" |
| T (TRACE) | Step-by-step program execution. As in the P command, the CS pair is used by default. I note that it is better to use the P. to perform interrupts. | T [\u003d.<адрес_начала>] [<количество_выполняемых_команд>] |
| U (Unassemble) | Disassembling machine code; The default pair of CS: IP. Unfortunately, Debug.exe incorrectly disassembled the specific commanders of 80286+ processors, although they are still performed correctly. | U [<начальный_адрес>] U [<начальный_адрес конечный_адрес>] |
| W (Write) | Record file from debug.exe; It is necessary to set the file name of the n command N, if it has not been loaded. And programs are recorded only in the form of files.com! | W [<адрес> [<номер_диска> <начальный_сектор> <количество_секторов>]] |
View memory areas
Consider the team's work in detail. D.allowing you to view the contents of individual memory areas. This example uses the command D. To view the memory area, starting from 0159: 0240:
Here, on the request view of the memory site, we received eight lines in which the contents of the selected memory area are specified. Each line consists of three parts:
· Address of the first left of the shown byte in the format segment: Offset.
· Hexadecimal representation of the paragraph (16 bytes), starting with the byte specified at the beginning.
· Symbols of the same paragraph in ASCII-format.
The address specified in the string belongs exclusively to the first byte in the paragraph, and the addresses of subsequent bytes should be calculated independently. The hexadecimal view contains two characters in each pate, and the bytes themselves are separated by spaces to facilitate reading. In addition, it should be noted that the eighth and ninth bytes are separated by a hyphen, thereby separating the paragraph into two parts and facilitating the calculation of the addresses of bytes in the paragraph.
Useful receptions with team D
Check parallel and serial ports
The first 16 bytes of the BIOS data area contain addresses of parallel and serial ports. Therefore, using the following command, you can check these ports:
The first eight bytes declared to the addresses of serial ports COM1-COM4.. The following 8 bytes indicate the addresses of parallel ports. LPT1-LPT4.. For example, if you have one parallel port on your computer, the first two bytes will most likely be: 7803. The port address is recorded in the reversed sequence, i.e. 0378.
Checking equipment
The first two bytes located in the BIOS at 410h contain information about the equipment installed in the system. Find these bytes by the team:
Suppose that the first two bytes will be 23 44. We will decrypt these bytes to obtain information about installed devices. To do this, turn these bytes (44 23), then translate them into binary system Note. We get:
| Bit value | ||||||||||||||||
| Bit position |
What do these bits mean? We continue to decipher:
Checking the status of the keyboard register
In the data area Bios. by the address 417h The first byte is located, which stores the status of the keyboard register. Turn off Num Lock. and Caps Lock. , then you type:
The first byte will be 00. Including Num Lock. and Caps Lock., I register the team again. Now the first byte must be equal to 60. The experimental way is established that when turned on Num Lock. The first byte is 20, and when Caps Lock. - 40.
Verification of the state of the video system
By the address 449h. in Bios. There is the first video data area. We type for verification:
The first byte shows the current video mode (for example, 03 - color), and the second is the number of columns (for example, 50 - mode with 80 columns). The number of rows can be found at 484h (40:84).
Checking the BIOS copyr and serial number
Copyright information on Bios. Built in B. Rom Bios. by the address FE00: 0.. A string with a copywriter can be easily found in ASCII sequence, and serial number - in the form of a hexadecimal number. Although, a string indicating copyright may be long and not to fit into the dismantled memory area. In this case, you should simply enter again D..
Checking the Date of the BIOS arrangement
This date is also recorded in Rom Bios. Starting with the address FFFF: 5.. After executing the appropriate command in ASCII sequence, this date recorded in the format will be mm / DD / GG.
Direct input of the program in memory using debug.exe
debug.exe. Allows you to enter a program directly into the memory of the machine, and then monitor and manage execution. We will enter a program in machine codes using the command. E.. At the same time be vigilant - entering erroneous data to an erroneous address is fraught with unpredictable consequences! Although serious problems in the system are unlikely to lead, but losing all the data introduced in debug.exe., it is easy. The program you want to enter uses the data laid directly in the instruction body. Next, the listing of programs on the assembler is shown, in the comments, the analogues of the commands of the language in the machine codes are indicated, as well as the explanation of each command. Note that there are no symbol in numbers h.because, as mentioned above, debug.exe. It only understands the numbers in the hexadecimal system.
MOV AX, 0123; Code B82301: We enter the value of 0123H in AX
ADD AX, 0025; Code 052500: add 0225h to AX value
MOV BX, AX; Code 8BD8: Enter the value of AX in BX
ADD BX, AX; 03D8 code: add AX to BX
MOV CX, BX; Code 8BCB: Enter the value of BX in CX
SUB CX, AX; Code 2BC8: Take the value of AX from CX
Sub AX, AX; Code 2BC0: Clean AX
JMP 100; EBEE code: go to the beginning of the program
As you can see, each machine instruction has a length from 1 to 3 bytes. The first byte indicates the operation, subsequent - its operands. The execution of the program begins accordingly from the first instruction and consistently passes through all instructions one after another. Now you can enter a program in memory. We divide the machine code into three parts by six bytes and introduce each using the command E. and starting with the address CS: 100..
Now that the program is entered into memory, let's try to manage it. For starters check current state registers and flags, for this we enter the command R.. The debugger will display the contents of the registers in hexadecimal form; on the different machines The contents of the registers may vary.
So, as you can see debug.exe. Initialized segments Ds., Es, SS., CS. The same address. Register IP contains 0100 , indicating that instructions are performed from offset 100h. about CS. (And we, inserting instructions in memory, just indicated this address).
The values \u200b\u200bof the overflow, directions, interrupts, sign, zero, additional transfer, parity, and transfer are also indicated here.
After registers and states of the debug.exe flags, displays information about the first instruction that will be performed:
· The address of the instruction, in our case it is 0B12: 0100, where 0B12 is the address of the code segment.
· Machine code corresponding to this manual (B82301).
· Actually instruction recorded on assembler (MOV AX, 0123).
Now, after analyzing the contents of registers and flags, let's go to the execution of the program. We will execute the program we will step by step using the command T.. Using the team for the first time T.we carry out instructions MOV.. Here is the operant machine code instruction - 2301 . Operation places 23 in Al (younger half AX.), but 01 - in AH. (older). Thereafter debug.exe. again displays information about registers:
Now AX. contains 0123h, IP ‑ 0103h (Consequently, the length of the executed instruction: 0103h - 0100h = 3 Byte), and as the next instruction an operation is indicated Add.. So after once performing the team T., we come to the last instruction JMP 100.. She will install a register IP in 100h., I. debug.exe. will return to the beginning of the program. Returning to the beginning of the program, it should be noted that Ds., Es, SS. and CS. Contains the same address. The fact is that debug.exe. considers the entered programs exclusively as programs .Com.. And in programs .Com., Unlike .Exe, Stack, code and data are stored in one segment.
Assembly and disassembly
In the last example, we introduced a program in machine codes, however, debug.exe. It is quite capable of understanding the instructions recorded on the assembler. To work with such programs in debug.exe. Teams are used A. and U..
Team A. Requests the instructions on the assembler and converts them into the machine code. To begin, initialize the initial address to enter instructions (100h):
The debugger will display the address of the code and offset segment (for example, 13F2: 0100.). Now we must enter the following instructions on the assembler in memory, after each row clicks ENTER:
After entering the last instruction, click ENTER Twice to specify the debugger that we finished entering the text of the program. Now the program can be launched using commands. R. To view registers and T. For trace. I note that in your programs in the presence of instructions Int. They should be processed not by the team T.and team P.which processes all interrupt immediately.
Let us turn to the disassembling procedure, and as an example, we just entered the program. Use the addresses of the first and last instructions to specify the range that we are going to disassemble, i.e. 100h. and 107h..
After performing this command debug.exe. Displays the instructions in the specified range, on the assembler, in the machine codes, as well as the address of each instruction:

Saving a program on the disk
First set the file name:
Then in the register SK You must place the size of the program in bytes. It will be equal to the difference in finite and initial displacements. Now it remains only to record on the disk W. And as a result, see the recorded number of bytes. As a result, we get a program ready for execution.
Exit is carried out by the team q.. Example:
0B3B: 0100 MOV AX, 1234
0B3B: 0103 MOV AH, 4C
0B3B: 0105 INT 21
0B3B: 0100 B83412 MOV AX, 1234
0B3B: 0103 B44C MOV AH, 4C
0B3B: 0105 CD21 INT 21
AX \u003d 0000 BX \u003d 0000 CX \u003d 0007 DX \u003d 0000 SP \u003d FFEE BP \u003d 0000 Si \u003d 0000 di \u003d 0000
DS \u003d 0B3B ES \u003d 0B3B SS \u003d 0B3B CS \u003d 0B3B ip \u003d 0100 NV UP EI PL NZ NA PO NC
0B3B: 0100 B83412 MOV AX, 1234
Record 00007 byte
To fulfill this laboratory work It will take several assembler commands:
MOV AH,<шестнадцатиричное число> - entry in the register AH. numbers 02 To specify the system function - the output of the symbol on the screen;
MOV DL,<шестнадцатиричное число> - entry in the register DL symbol code;
INT 21 - the main interruption of the DOS (procedure) that implements many different functions; The function number is recorded pre-in the AH register; To print a symbol on the screen - in the AH register, the function 02, while in DL Record the preset symbol code.
INT 20 - DOS interrupt that exits the program (from -2-program).
Example:
Display the "*" symbol.
mOV AH, 02; system function 02 - Symbol output on screen
mOV DL, 2A; Ascii-code asterisk
iNT 21H; Interrupt for the output "*"
int 20h; Exit program
purpose
Acquaintance with debugger debug.exe. Getting practical skills to work with this program.
Equipment:
Personal Computer running the Windows operating system.
Software:
DEBUG program.
Questions to admission
1. What is the Debug program?
2. How to run this program?
3. How are teams in Debug are introduced?
4. What is the identifier?
5. How to enter a program in Debug?
The task
· Examine theoretical material.
· Do the command described in the course of the text.
· Find the amount and difference of 2 numbers: 1st number - number in the group (translated in hexadecimal shape), 2nd - the number opposite to the number of the first letter of the name in the alphabet ( a negative number in additional code). The amount and difference are translated into the decimal form.
· Review the contents of the microprocessor registers, as well as flags and write them into the protocol. What function does each of the registers perform? .
· Write the first number to the AX register (from the task 3), and in the BX register - the second (from the task 3). Enter B. rAM In the code segment (offset 100), the machine crew of the AX and BX registers. View its assembler form on the screen. Perform this command, result in a decimal form.
· Enter in RAM to the code segment (offset 100) Set of an assembler commands for printing the character on the screen - the first letter of your last name. Check the program in Debug. Then write it to the disk in the form of a server file. What is the size of the program? Run it to execute from DOS.
· All actions describe in the report.
1. Name of work.
2. The purpose of the work.
3. Instruments and equipment.
4. Brief theoretical information.
5. Description of the proceeds.
6. The text of the program being created.
7. Conclusions.
Control questions
1. What command to enter into memory data or machine code instructions?
2. How to compare the contents of two memory regions?
3. How to fill the memory area of \u200b\u200bdata from the list?
4. What command makes the fulfillment of the well-defined program?
5. What command writes file from Debug?
6. How is the assembly and disassembling?
Android Debug Bridge (ADB) is console programwhich will allow you to debug mobile devices on Android, as well as emulators.
Description
This utility greatly simplifies the installation and debugging of applications, and also provides access to the UNIX shell. The latter can be used to start the necessary commands on the device. Among other things, the program can be used to unlock the smartphone with the debug mode on. At the same time, it is worth noting that Android Debug Bridge supports work with any Android devices, provided that the necessary functionality has not been blocked by the manufacturer.
The program includes three components:
- Client. Works on the developer's PC, sends commands. To call the client, you can use the appropriate command in the terminal.
- Demon (ADBD). Performs commands on the device. Works in the background on each device.
- Server. Manages the interaction between the client and the demon. Works in the background on the developer's computer.
AdB Features:
- View a list of connected and supported devices.
- View logs.
- Copying and transferring data and files between devices.
- Installing and deleting applications.
- Cleaning and rewriting Data section.
- As well as much more.
From our site you can download Android Debug Bridge completely free, without registration and SMS.
Screenshots

The driver is at its essence binder between the operating system, that is software and iron, that is, physical devices, such as video cards, printers, processors, etc. In the operating system, the basic drivers for the most necessary devices can be laid - the mouse, keyboard, but for all the rest you will need fresh drivers.
How to install the driver?
1.If simple way if there is installation fileYou must simply run it and follow the installer's instructions.2. If there is no installer, but there are only files with * .inf extensions, * .dll, * .vxt, *. Sys, * .drv., The action algorithm must approximately following:
a) First you need to select an icon on the desktop ( My computer) and click on it right mouse button, select the Select menu in the drop-down menu Properties).
b) now go to the tab ( Equipment) and clicks on the button ( Device Manager).

c) Now you need to select the device for which the driver will be installed / updated. On the line with the device, you need to click on the right mouse button and select a drop-down menu ( Properties) Or you can simply click on it to go to the desired settings. 
d) go to the tab ( Driver), choose the button ( Refresh).

e) In the dialog box that appears, select the item ( No, not this time) and go through ( Further).
f) At this stage there are two options. You can try to install the drivers in automatic mode, then the OS itself will try to find a suitable driver device and install them, for this, choose ( Automatic installation (recommended)) if the attempt fails unsuccessfully, then you need to move to the second item ( Installation from the specified location) and choose ( Further).

g) This menu item involves the choice between the driver search on the interchangeable media and the option to specify the driver folder yourself. Therefore, if there is a drive with drivers, then you need to insert the disk in the CD-ROM and select the option ( Search for interchangeable media (diskettes, CDs ..)) and go ( Further).
If the driver is found and downloaded on the Internet yourself, you must specify a folder to the folder in which the installation data for the driver is as follows. Choose an item ( Enable the following search place:) and go to ( Overview), now choose the folder with the driver and click on the button ( OK). Now we safely go through ( Further) If everything is done correctly, the installation of the required driver will begin. 
Debugging Tools. for windows - Debug tools for operating code windows systems. They are a set of freely distributed programs from Microsoft, designed to debug a user mode code and kernel mode: applications, drivers, services, kernel modules. The toolkit includes debuggers of console and gui modes, utilities for working with symbols, files, processes, utilities to ensure remote debugging. The toolkit contains the utilities with which you can find the causes of failures in various components of the system. Debugging Tools for Windows From a certain point, it is not available for download in the form of an autonomous distribution and included in Windows SDK (Windows Software Development Kit). Set of instrumental windows The SDK, in turn, is available as part of the MSDN subscription program or can be freely loaded as a separate distribution from MSDN.microsoft.com. According to the development of developers, the last and most actual version Debugging Tools for Windows is contained in Windows SDK.
Debugging Tools for Windows is updated and laid out in public access Frequently often and this process does not depend on the release of operating systems. Therefore, periodically check for new versions.
Let's now see what, in particular, allow us tools for Debugging Tools for Microsoft Windows.:
- Debug local applications, services (services), drivers and kernel;
- Deleted application, service (services), drivers and kernels on the network;
- To debug the working applications in real time;
- Analyze application memory dump files, kernels and systems as a whole;
- Work with systems based on X86 / X64 / Itanium architectures;
- Debug the user mode and kernel mode;
The following versions of Debugging Tools for Windows are available: 32-bit x86, Intel Itanium, 64-bit x64. We will need two of them: x86 or x64.
Several ways of installing DEBUGGING Tools for Windows are available, in the given article we will only consider the main ones:
- Installation by means of a Web installer.
- Installing the Debugging Tools for Windows with an ISO image of a Windows SDK.
- Installing Debugging Tools for Windows directly from DBG_AMD64.MSI /DBG_X86.MSI packets.
It remains unclear what moment, why should I install debugging tools on a computer? Often, after all, come across the situation when interference in the working environment is extremely undesirable! And even more so that the installation of the new product, that is, making changes to the register / system files, may be completely unacceptable. Examples can serve as critical servers. Why developers do not consider the option with portable (portable) versions of applications that do not require installation?
From the version of the version of the installation process of the Debugging Tools for Windows package undergoes some changes. Let us now move directly to the installation process and consider ways that you can install the toolkit.
Installing Debugging Tools for Windows using a Web installer
Go to the Windows SDK archive page and find a section called Windows 10 and below "Windows 10 SDK (10586) and an emulator of the device with Windows 10 Mobile (Microsoft) (version 10586.11)".
Click on item Install the SDK package. After clicking, you download and run the sdksetup.exe file, which initiates the Windows SDK online installation process. At the initial stage, the installer will check the presence in the system of the installed package.NET Framework latest version (in this moment This is 4.5). If the packet is missing that the installation will be proposed and the station is rebooted at the end. Immediately after rebooting, at the authorization stage, the installation process starts immediately with Windows SDK.

Often, when choosing everyone, without exception, the package components, errors may occur during installation. In this case, it is recommended to install components selectively, the minimum required set.
After installing the Debugging Tools for Windows, the location of debug files when this method We will have the installations as follows:
- 64-bit versions: C: \\ Program Files (x86) \\ Windows Kits \\ X.x \\ Debuggers \\ x64
- 32-bit versions: C: \\ Program Files (x86) \\ Windows Kits \\ X.x \\ Debuggers \\ x86
* where x.x is a certain version of the development kit;
Noticed that version 8 and above, the installation paths are noticeably different from the classic for all previous versions Debug funds?
A huge plus this method Debigging Tools for Windows installation is setting versions of debug resources at once all architectures.
Installing Debugging Tools for Windows with ISO image Windows SDK
This method implies the installation of Debugging Tools for Windows using a complete installation image of Windows SDK (Software Developers Kit). Up to a certain time, download iSO image For the corresponding system, you could on the Windows SDK archive page. However, at the moment, you can get an ISO-image of an SDK via the SDKSETUP.EXE web installer launch and the selection of the item Download the Windows Software Development Kit In the starting window of the installer:
As it was found out, the previous installation method with a web installer is sufficiently capricious and often completes the error. On clean systems is established without problems, but numerous problems arise on sufficiently loaded. If you have such a case, then use this method.
Accordingly, on the page it is necessary to select the desired distribution, for me (and I think for many) at the moment it is " Windows Package SDK for Windows 7 i.NET Framework 4 "and slightly below click on the" Get ISO-Image DVD "link.
When working with the site msdn.microsoft.com, I advise you to use internet Browser Explorer, because cases of non-working capacity of competing products were noticed!
Accordingly, it is necessary to choose only if necessary. Usually the discharge of Debugging Tools for Windows coincides with the system's bit. I have the studied systems, mostly 64-bit, so in most cases I download the image for the 64-bit GRMSDKX_EN_DVD.iso system.
Then, after downloading the image, we need to work with the available ISO. In the traditional way, is, of course, recording a CD, but it is quite a long and sometimes costly method. I propose to use free utilities By creating virtual disk devices in the system. Personally, I prefer to use the Deamon Tools Lite program for this purpose. Someone can have other preferences, more direct or lightweight utilities, taste and color, as they say .. after installing Daemon Tools. Lite, I just click two times to the image file grmsdkx_en_dvd.iso and in the system I have a new virtual CD:

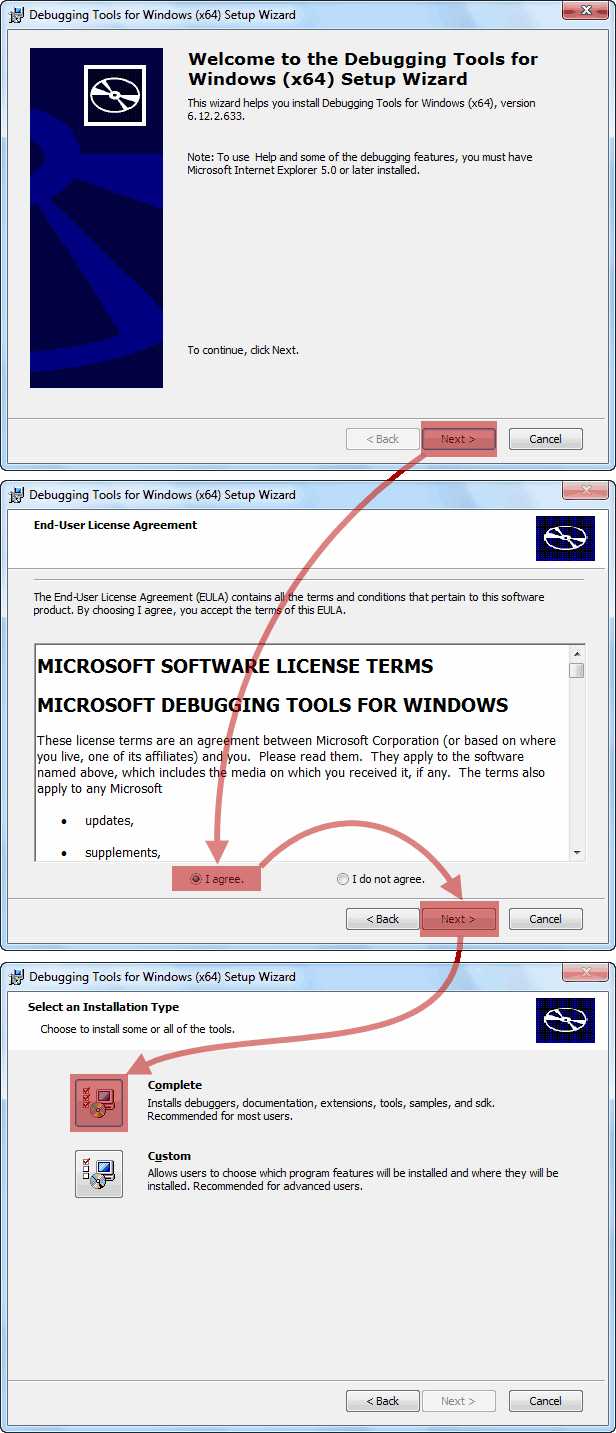
Already then double-click Activate autoload and start installing Windows SDK:

When there is a queue, select the components installed from the list, then we turn off absolutely all the options are other than marked in the screenshot. This will help avoid unnecessary errors now.

All this way, in the screenshot there are two options: "Windows Performance Toolkit" and "Debugging Tools for Windows". Choose both, because Windows Performance Toolkit will certainly be useful to work! Next, after pressing the "Next" button, the installation continues in as usual mode. And at the end you will see the inscription "Installation Complete".
At the end of the installation, the working directory of the DEBUGGING Tools for Windows will be as follows:
- For x86 version:
- For x64 version:
On this installation, Debugging Tools for Windows can be considered over.
Installing Debugging Tools for Windows through. MSI file
In case of problems when installing DEBUGGING Tools for Windows, two previous ways, we still have another, the most reliable and time-tested time, cutting, so to speak, more than once. Once, before integrating in Windows SDK, Debugging Tools for Windows has been available in the form of a separate installer. MSI, which can now be found, but already in depths windows Distribution SDK. Since our hands already have an ISO-image of Windows SDK, we can not mount it into the system, but simply open with all the familiar archiver winrar.Well, or any other product that works with the contents of ISO-disks.
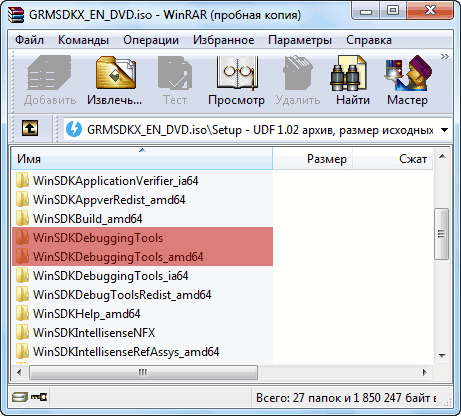
After opening the image, we need to go to the "SETUP" directory, which is found in the root and then select one of the directory:
- To install the 64-bit version: \\ SETUP \\ WINSDKDEBUGGINGTOOLS_AMD64 and unpack from this directory file dbg_amd64.msi.
- To install the 32-bit version: \\ setup \\ winsdkdebuggingtools and unpack the DBG_X86.MSI file from this directory.
At the end of the installation, the working directory of the DEBUGGING Tools for Windows will be as follows:
- For x86 version: C: \\ Program Files (x86) \\ Debugging Tools for Windows (x86)
- For x64 version: C: \\ Program Files \\ Debugging Tools for Windows (x64)
On this installation, the Debugging Tools for Windows can be considered made.
additional information
I do not know what it is connected with, perhaps with my inattention, but after installing debugging for Windows, the installer does not prescribe a path to the catalog with a debugger in the system variable. This imposes certain restrictions on the launch of various debug tasks directly from the console. Therefore, in the absence of a path, I independently prescribe in the window Environment Variables The path to debugging means:
- C: \\ Program Files (x86) \\ Windows Kits \\ 10 \\ Debuggers \\ x86
- C: \\ Program Files (x86) \\ Windows Kits \\ 10 \\ Debuggers \\ x64
* In your case, the paths may differ both due to the use of OS other bit and because of the use of the SDK of another version.
The DEBUGGING Tools For Windows package utilities can work as portable applications, just copy with working system catalog Microsoft Windows Performance Toolkit And use it as a portable version on the operating server. But do not forget to take into account the size of the system !! If you even made a complete installation of a package on a critical-important system, you can start working right after installation, no reboot is required.
Composition Debugging Tools for Windows
And now I will finally be the composition of Debugging Tools for Windows:
| File | Purpose |
|---|---|
| adplus.doc. | Documentation on the ADPLUS utility. |
| adplus.exe | Console application that automates the work of the CDB debugger to create dumps, log files for one or more processes. |
| agestore.exe. | The utility to remove outdated files from the storage used by the Symbol server or the source server. |
| breakin.exe. | The utility that allows you to send the processes a combination of a custom stop (break), similar to pressing Ctrl + C. |
| cDB.exe. | Console Debugger Custom Mode. |
| convertstore.exe | The utility for converting characters from a level of 2-Tier to 3-Tier level. |
| dbengprx.exe. | Ripiter (proxy server) for remote debugging. |
| dbgrpc.exe. | The utility for displaying information about the call status of RPC. |
| dbgsrv.exe. | Server process used for remote debugging. |
| dbh.exe. | The utility to output information about the contents of the symbol file. |
| dumpchk.exe. | Dump check utility. Utility for fast check dump file. |
| dumpexam.exe. | Utility for analysis of dump of memory. The result is displayed in% Systemroot% \\ Memory.txt. |
| gflags.exe. | Editor of global flags system. The utility manages registry keys and other settings. |
| i386kd.exe. | Wrapper to kd. When it was so called kd for systems on windows database NT / 2000 for x86 machines? Probably left for considerations of compatibility. |
| iA64KD.exe. | Wrapper to kd. When was the so-called KD for Windows NT / 2000 based systems for IA64 machines? Probably left for considerations of compatibility. |
| kd.exe. | Console kernel mode debugger. |
| kdbgctrl.exe. | Core debugging tool. Utility for managing and configuring Kernel Debugging Connection. |
| kdsrv.exe. | Connection server for kd. The utility is a small application that runs and is waiting for remote connections. KD starts on the client and connects to this server for remote debugging. And the server and the client must be from the same Debugging Tools assembly. |
| kill.exe. | Utility to complete the processes. |
| list.exe. | Utility to display the contents of the file to the screen. Included this miniature utility turned out to be with one goal - viewing large text or log files. It takes a little place in memory, since loads text with parts. |
| logger.exe. | A miniature debugger that can only work with one process. The utility implements the logexts.dll into the process space, which records all the features and other actions of the program under study. |
| logViewer.exe. | The utility for viewing the logs recorded by the Logger.exe debugger. |
| ntsd.exe. | Microsoft NT SYMBOLIC DEBUGGER (NTSD). Debugger, identical to CDB, except that it creates a text box when started. Like CDB, NTSD is able to debug and console applications and graphic applications. |
| pdbcopy.exe. | The utility to remove private characters from the symbol file, control over public characters included in the character file. |
| remote.exe. | The utility for remote debugging and remote control of any Console Debugger KD, CDB and NTSD. Allows you to run all these console debuggers remotely. |
| rTList.exe. | Remote viewer tasks. Utility is used to display the list running processes Through the DBGSRV server process. |
| symchk.exe. | The utility for downloading characters from Microsoft characters server and creating a local symbol cache. |
| symstore.exe. | The utility for creating a network or local storage of characters (2-Tier / 3-Tier). Storage of characters is a specialized directory on a disk, which is built in accordance with a specific structure and contains characters. In the root directory of characters, the structure of subfolders with names identical to the name of the components is created. In turn, in each of these subfolders there are subfolders that have special names obtained by the method of hashing binary files. The symstore utility scans folders with components and adds new components to the storage of characters, from where any client can get them. It is said that the symstore serves to obtain characters from the 0-Tier level storage and lay out them in the 2-Tier / 3-Tier level storage. |
| tlist.exe. | Task Viewer. Utility to display a list of all running processes. |
| umdh.exe. | User-Mode Dump Heap Utility. Utility for HEAP analysis (HEAP) of the selected process. Allows you to output various parameters for a heap. |
| uSBVIEW.exe. | USB viewer. Utility for viewing USB devicesconnected to the computer. |
| vmdemux.exe. | Demultiplexer virtual machine. For one COM connection creates several named channels. Channels are used to debug various components of the virtual machine. |
| windbg.exe. | Debugger of the user mode and kernel mode with a graphical interface. |
1)
Run the Virtual PC 2007 with Windows XP. Translate OS to command line mode.
Start -\u003e Run -\u003e Enter CMD and press ENTER.
2)
Get and fix the certificate on the command options Debug
In the console: enterdebug, then (?).
Brief list All teams:
A (ASSEMBLE) - Translation of assembler commands in machine code. Default address - CS: 0100H.
C (Compare) - Comparison of the contents of two memory regions. Default is used Ds.. The command indicates either the length of the plots or the range of addresses.
D (DUMP) - Displays the contents of the memory area in hexadecimal and ASCII formats. Default is used Ds.. You can specify a length or range.
E (ENTER) - Entering data or machine code instructions. Default is used Ds..
F (Fill) - Filling the memory area data from the list. Default is used Ds.. You can use both the length and range.
G (GO) - The fulfillment of the well-defined program in the machine to the specified stop point. Default is used Ds.. It should be ensured that IP Contains the correct address.
H (Hexadecimal) - calculating the amount and difference between two hexadecimal values.
I (INPUT) - Read and output one byte from the port.
L (LOAD) - Download a file or data from the disk sectors to memory. . Default - CS: 100h.. File can be specified using the command N. or argument when starting debug.exe.
M (Move) - copy the contents of the memory cells; Default is used Ds.
N (Name) - Specify the name of the file for commands L (LOAD) and W (Write).
O (Output) - Location byte to the output port.
P (Proceed) - execution of instructions Call, Loop, Int (Cycle, Interrupts, Procedures) or repetitive string instructions with prefixes REPNN.passing to the next instruction.
Q (Quit) - Completion of work debug.exe.. Without saving the test file.
R (Register) - Display the contents of the registers and the following instruction.
S (Search) - Search in memory characters from the list. Default is used Ds.. You can specify both the length and range.
T (TRACE) - Step-by-step program execution. As in the team P.The default pair uses CS: IP.. But to perform interrupts it is better to use the team P..
U (Unassemble) - disassembling machine code. The default pair uses. CS: IP..
W (Write) - write a file from debug.exe. to disk. It is necessary to set the file name as a command N.if it was not loaded.
3)
We get and fix the dumps of the characteristic areas of RAM and ROM
I dial the R command.
Registers CS., Ds., Es, SS. At this point initialized the address of the 256-byte prefix of the program segment, and the work area in memory will begin with addresses of this prefix + 100h.
Command set rules:
A) B. debug.exe. Does not differ register of letters.
B) Spaces in commands are used only to separate parameters.
C) the numbers entered must be in a hexadecimal number system, and without final letters h..
D) segment and offset are written using a colon in format segment: Offset.
4)
View memory area.
Team D.allows you to view the contents of individual memory areas.
Check the size available for memory. To do this introduce: d 40:13. and input.
The first two bytes that appeared on the screen contain the memory size in kilobytes and in hexadecimal representation, the bytes are located in the reverse order. We have it: 8002 0280 640 (K)
- Address of the first to the left of the shown byte in the format segment: Offset.
- Sixteen Presentation of the paragraph (16 byte), starting with the byte specified at the beginning.
- Symbols of the same paragraph in ASCII format.
4)
Check parallel and serial ports.
The first 16 bytes of the BIOS data area contain addresses of parallel and serial ports. The first baked eight bytes indicate the addresses of serial ports COM1-COM4. The following 8 bytes indicate the LPT1-LPT4 parallel port addresses. Port address 78 03 - written in reverse form.
5)
Check the status of the keyboard register.
In the data area Bios. by the address 417h There is the first byte, which stores the status of the keyboard register ..
6)
Checking the Date of BIOS.
Copyright information on Bios. Built in B. Rom Bios. by the address FE00: 0.. A string with a copywriter can be easily found in ASCII. -Exterativeness, and serial number - in the form of a hexadecimal number. You can see the seven-digit computer number and the copywrit date. Although, a string indicating copyright may be long and not to fit into the dismantled memory area. In this case, you should simply enter again D..
Date is also recorded in Rom Bios. Starting with the address FFFF: 5.. After performing the appropriate command in ASCII. -The sequence will be this date recorded in format mm / DD / GG.
7)
An example of machine codes.
Consider the creation of a program in the machine language, its presentation in memory and the results of execution. Debugger team A (ASSEMBLE) Translate Debug. To receive assembler commands and translating them into machine codes.
Now that the program is entered into memory, let's try to manage it. To begin with, check the current state of the registers and flags, for this we enter the command R..
IP - Register containing the address-shift of the following command to be executed relative to the code segment CS. In the processors of the X86 family.
Register IP associated with CS. as CS: IP.where CS. is the current code segment, and IP - The current displacement relative to this segment.
Register IP It is a 16-bit indicator register. Besides him, the registers of this type include Sp. (Stack Pointer. - stack pointer) and BP. (Base Pointer. - Basic pointer).
Record CX. Passed successfully and equal to 8th. An initialization of segments occurred Ds., Es, SS., CS. The same address. Register IP contains 0100 , indicating that the instructions are performed from offset 100h relative CS (from him and started).
Value |
Description |
No overflow |
|
Referring up or right |
|
Interrupt resolution |
|
Positive sign |
|
Non-zero value |
|
Lack of additional transfer |
|
Odd word |
|
| 0
B.16
- Code segment address.
Perform it. You must inform the debugger address of the first and last command you want to view (we have 100 and 107). Instructions appear in the specified range, on assembler, in machine codes, as well as the address of each instruction. Perform step-by-step program using the command T.. Using a team for the second time T.we fulfilled instructions MOV.. Operand Machine Code Instructions - 00D8.. Operation adds Al to BL.. For exit introducing Q.. And again disassemble created testpi.com..
Change or copy code Bios. can disrupt the copyright of the manufacturer Bios.. Bios. You can copy or modify only for individual use purposes, but not for distribution. Typical copying procedure Bios. Using the program Debug. Let us give below. This procedure will save the entire segment in 64 KB with the address in the file. F000: 0000H by F0000: FFFFH. Conclusions:
|